Your engagement rate is the share of your followers (or viewers) who do something with your post: like it, comment, share it or save it. To calculate it, divide the interactions on a post by your number of followers and multiply by 100. What counts as normal depends heavily on the platform and your follower count: on an Instagram account with 1,000 to 5,000 followers, an ordinary post gets likes from around 3.5 to 4.8% of followers; on an account with a few hundred thousand followers, from around 0.4 to 1%.
Want to see it for your own account right away? Our free calculator shows roughly what an ordinary post gets at your follower count, based on the studies further down this article.
Free toolEngagement rate calculatorSee which likes, comments and views are normal for your follower count on Instagram, TikTok, YouTube and Facebook, and compare them with your own numbers.Open the calculatorWhat is engagement rate?
Engagement rate measures how many people do something with what you post, compared with how many people could have seen it. A like, a comment, a share or a save: they all count as interactions.
The figure tells you more than a number of likes on its own, because it takes the size of your account into account: 200 likes is a lot with 2,000 followers and very little with 200,000. That is also why brands and agencies look at it when they want to know whether your audience is genuinely involved.
How to calculate engagement rate: the formula
There are two ways to calculate it:
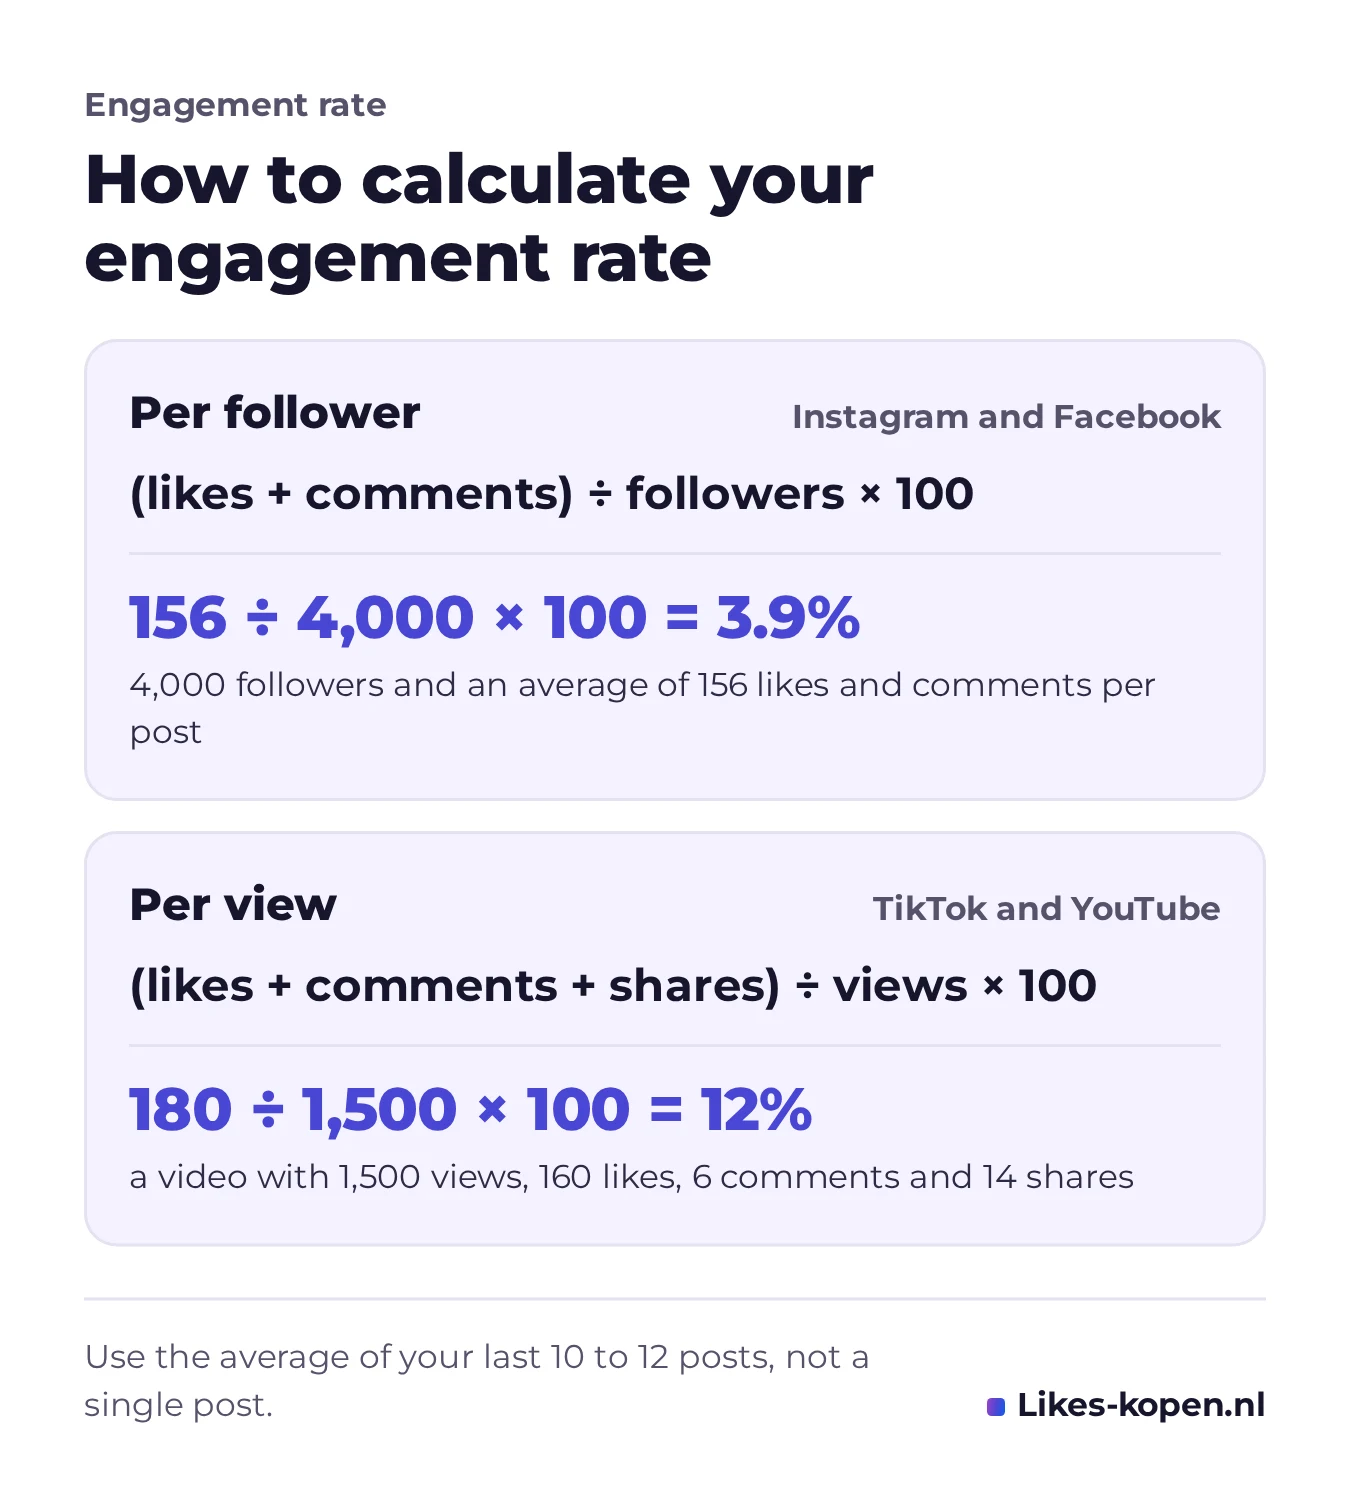
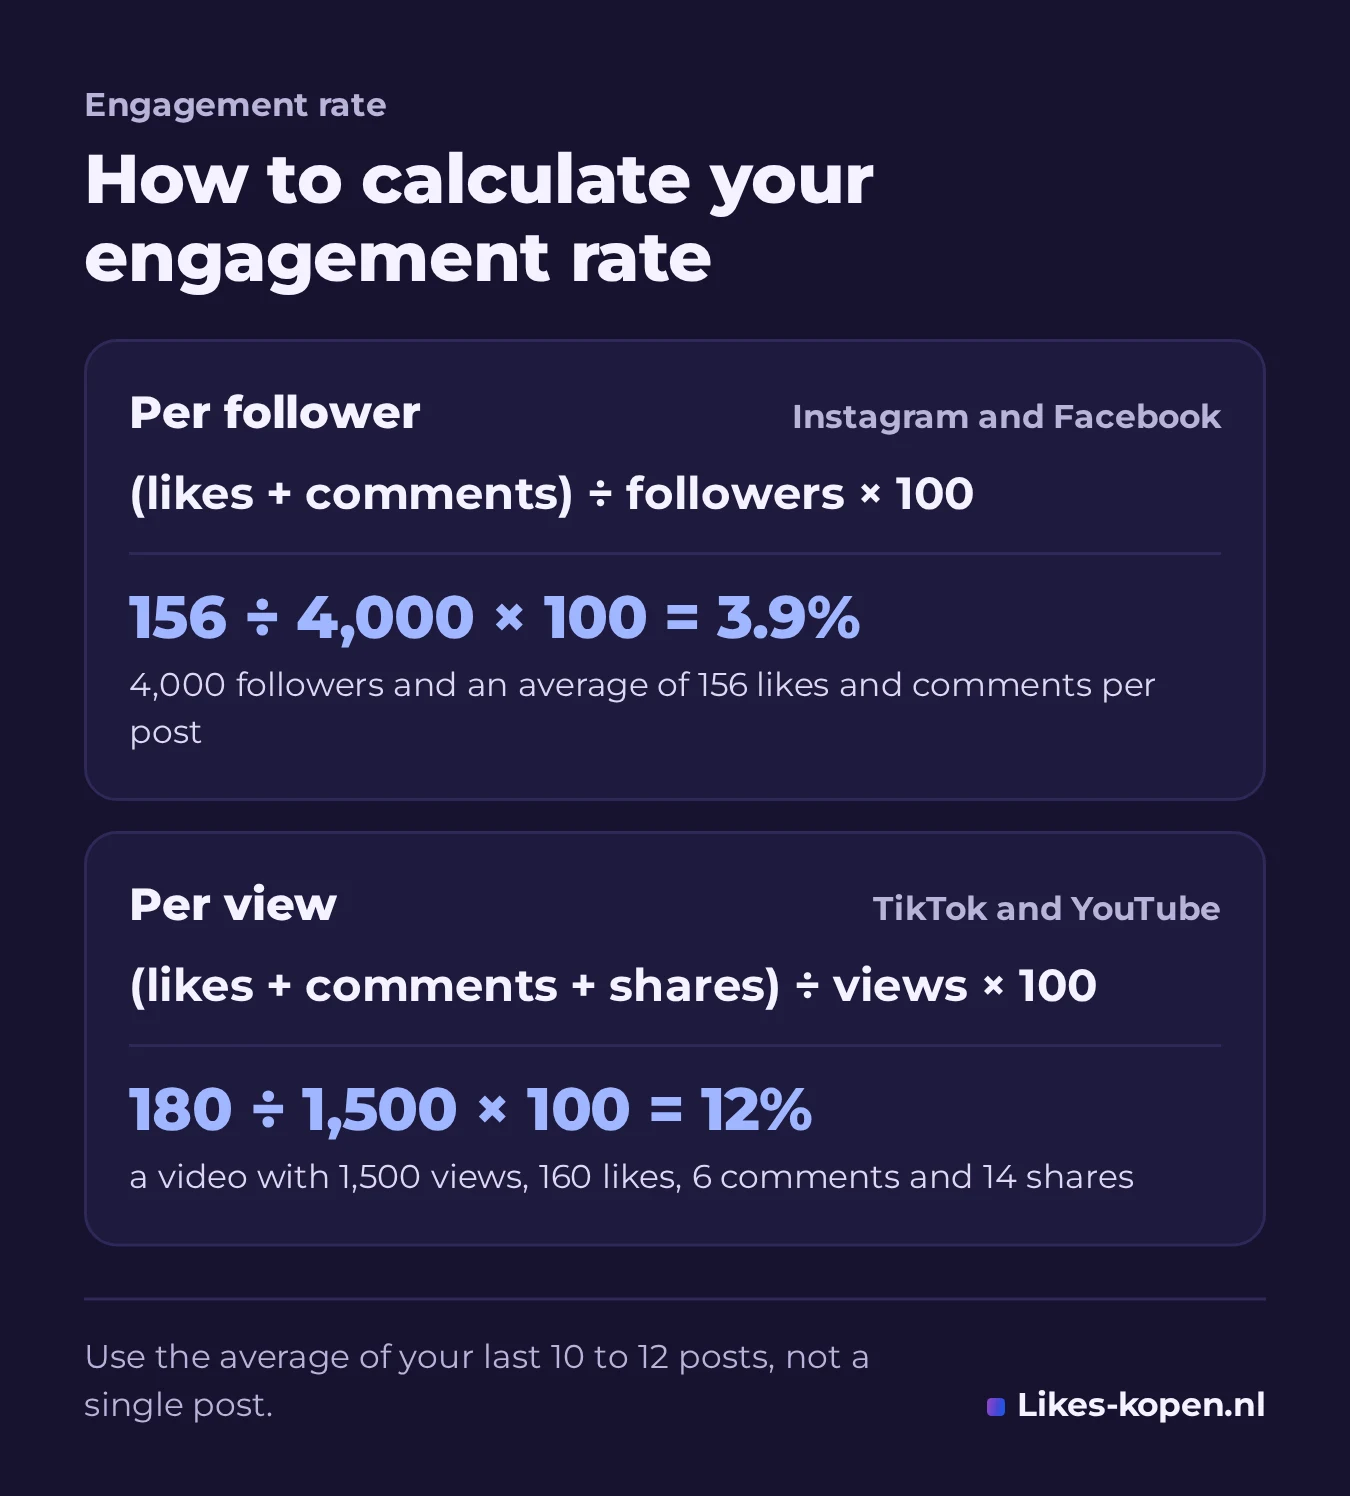
- By followers: interactions on a post divided by your number of followers, times 100. This is the classic formula for Instagram and Facebook.
- By views: interactions divided by the number of views, times 100. This is the usual method for TikTok and YouTube, where many viewers don’t follow you.
Don’t work it out from a single post, but from your last 10 to 12 posts. Tools such as HypeAuditor and Modash take the median, so one outlier does not decide the figure. What you count differs per platform:
- Instagram: likes and comments, divided by your followers. How often a post was saved is only visible on your own posts.
- TikTok: likes, comments and shares (sometimes saves too), divided by views.
- YouTube: likes and comments, divided by views.
- Facebook: all likes (including hearts and the other emoji reactions), comments and shares, divided by your followers.
Worked example
Say you have 4,000 followers on Instagram and your last ten posts received 1,500 likes and 60 comments between them. That is an average of 156 interactions per post. 156 divided by 4,000 is 0.039, and times 100 that gives 3.9%.
On TikTok you work with views. A video with 1,500 views, 160 likes, 6 comments and 14 shares has 180 interactions, so 12%. By followers, with 5,000 followers, that is 3.6%. Both are normal for accounts of this size, as the table below shows.
What is a good engagement rate?
There is no single figure that is good for everyone: compare yourself with accounts on the same platform and of the same size. This is what an ordinary post normally gets, according to HypeAuditor, Modash, CreatorDB and Socialinsider (2025 and 2026):
| Followers or subscribers | 1,000 to 10,000 | 10,000 to 100,000 | 100,000 to 1 million | Over 1 million |
|---|---|---|---|---|
| Instagram: likes per follower | 1 to 4.8% | 0.4 to 1.2% | 0.4 to 1% | 0.5 to 1.2% |
| TikTok: views per video | 280 to 760 | 580 to 12,400 | 3,400 to 113,500 | 32,000 to 280,000 |
| TikTok: interactions per view (median) | 11 to 13% | 7.6 to 8.9% | 6.5 to 7% | about 6.5% |
| YouTube: likes and comments per view | 2 to 6.8% | 2 to 6.7% | 1.7 to 5.8% | 1.2 to 4.5% |
| Facebook: likes per follower (business pages) | 0.17 to 0.36% | 0.06 to 0.18% | 0.02 to 0.12% | no data |
Sources: Instagram from Modash (median of over 84 million profiles) and HypeAuditor (average); TikTok from HypeAuditor (views) and Modash (November 2025); YouTube from CreatorDB (1.4 million channels, August 2026, long videos, middle half of the channels); Facebook from Socialinsider (business pages, 2025 and 2026).
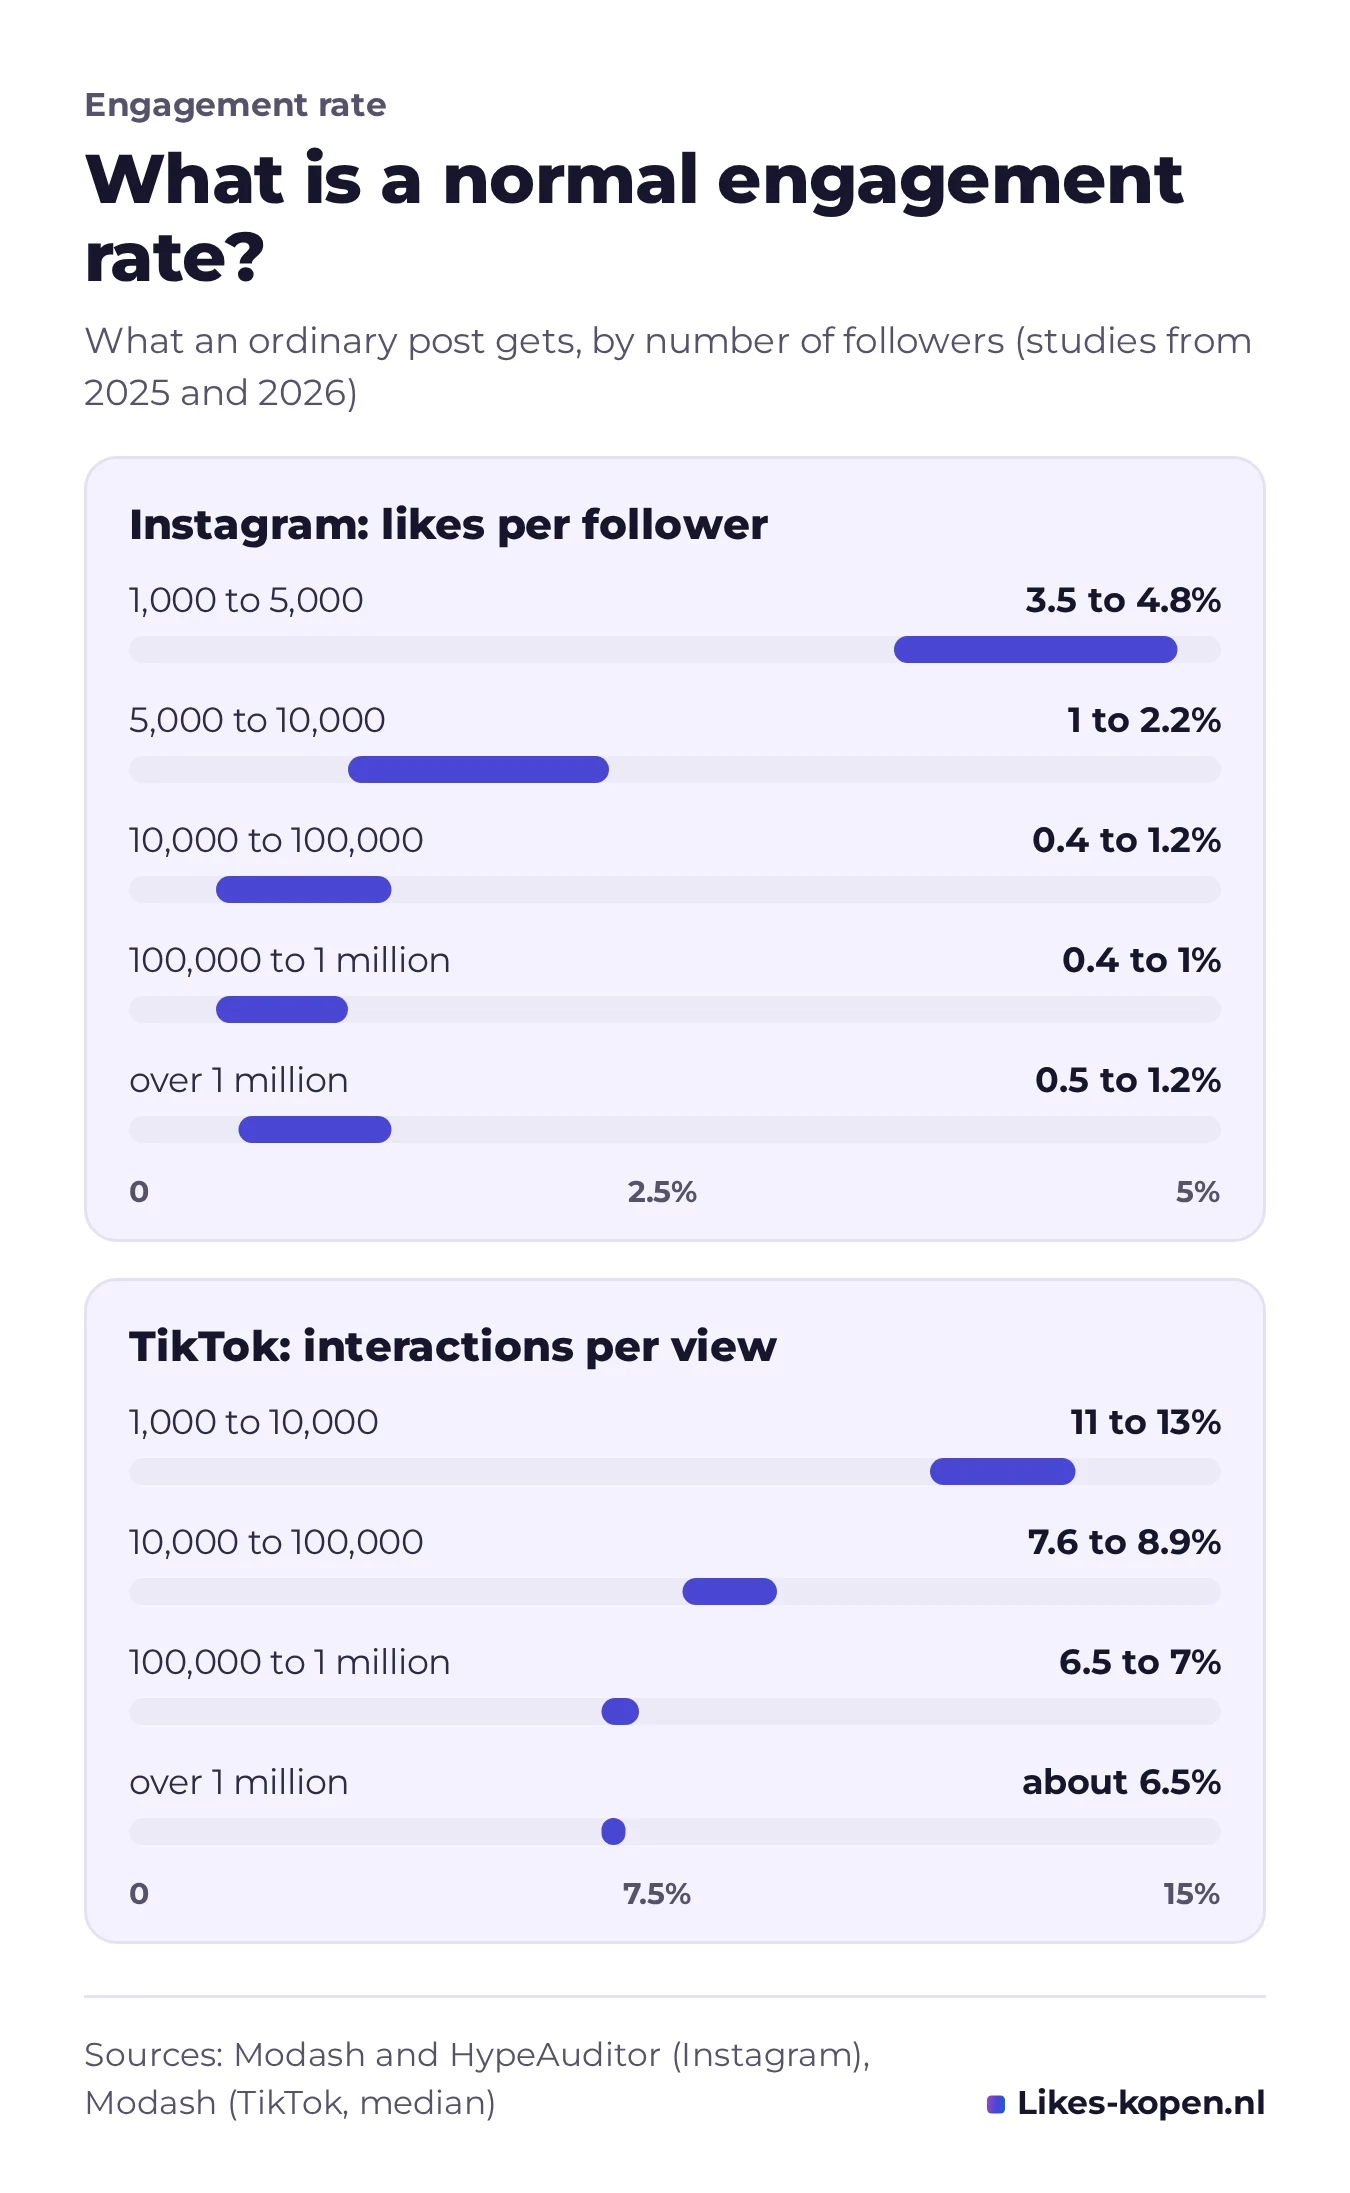
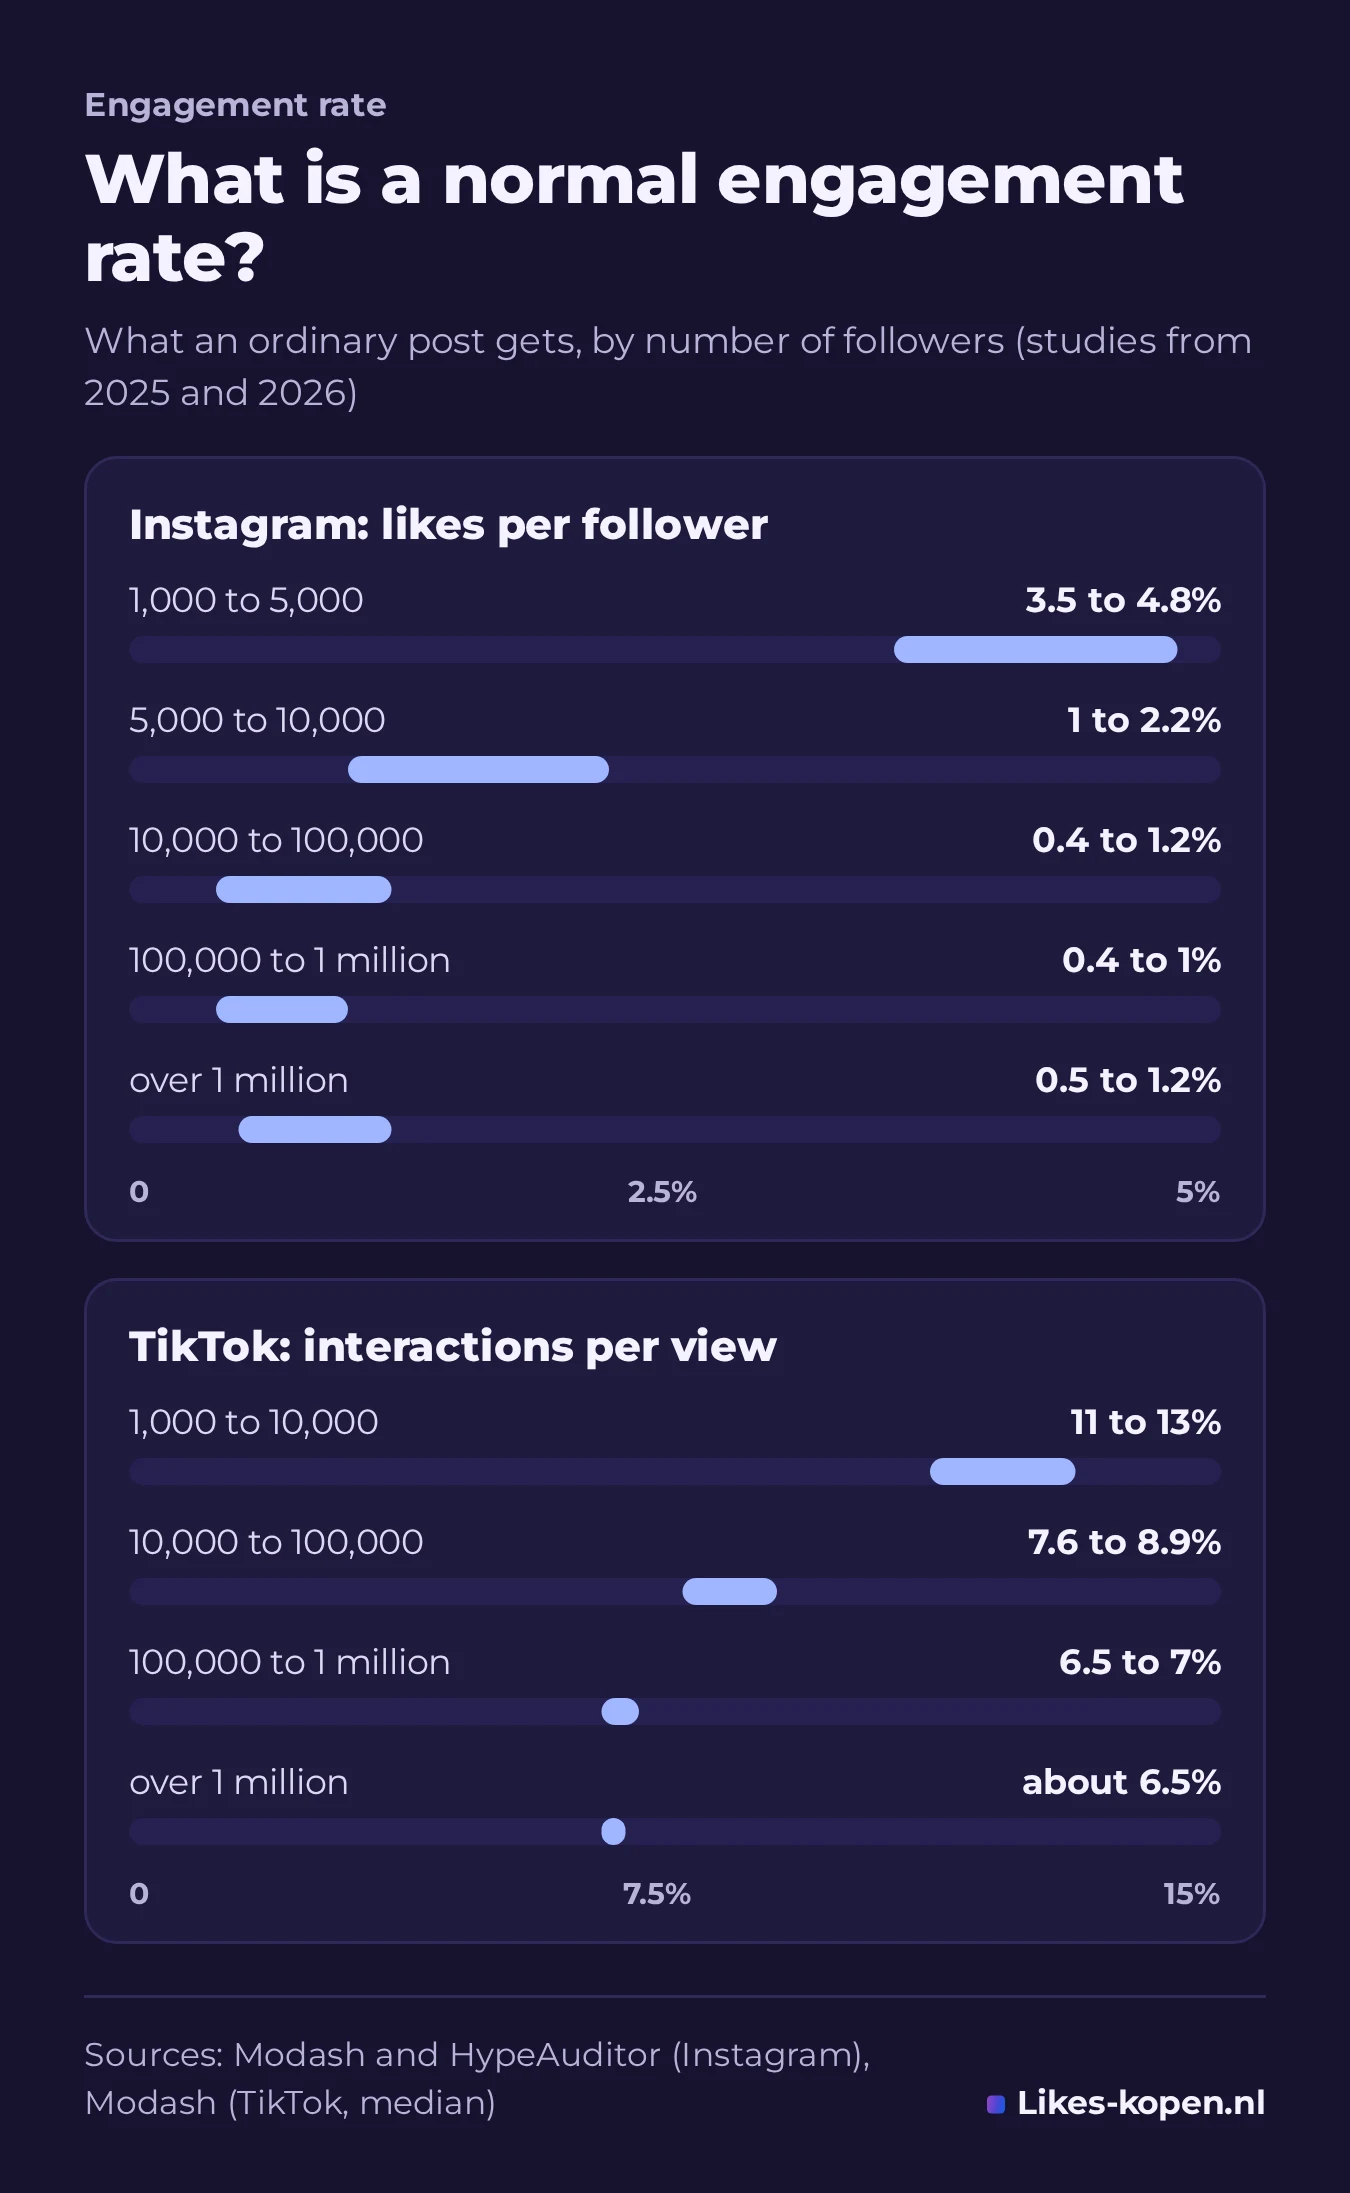
On Instagram the spread within the smallest group is wide: under 5,000 followers, 3.5 to 4.8% is normal; between 5,000 and 10,000 followers, 1 to 2.2%. For accounts under 5,000 followers, Modash calls anything above 6% high and anything below 1.85% low; from 10,000 followers, anything above 1% is already good. On TikTok, more than 10% per view is strong for accounts under 10,000 followers, and more than 7% for larger ones.
Business accounts score lower: for brands in 2025, Rival IQ found a median of 0.30% per follower on Instagram and 2.01% on TikTok. Averages are also higher than what an ordinary post gets, because viral posts pull them up. That is why we use the median wherever we can.
How it has changed in recent years
On Instagram, engagement rates have been falling for years. HypeAuditor measured 1.85% for creators in 2023 and 1.59% in 2024; for brands, the median dropped from 0.36% to 0.30% (Rival IQ). On TikTok, engagement per follower fell as well, to 2.6 to 2.7% for business accounts in the first half of 2026 (Socialinsider).
The way it is measured is changing too. Many tools now calculate per view, and since 24 August 2026 YouTube counts a view from the first frame for all videos (for Shorts that has been the case since March 2025). Your engagement rate per view on YouTube may therefore come out lower than in older figures.
Why larger accounts score lower
- The bond is looser. Research in the Journal of Marketing (2023, more than 1,700 influencers) shows that a large follower count feels like a weaker relationship, which makes followers less likely to respond.
- There are more passive followers. The older an account, the more of its followers are no longer active. They count in the calculation but do nothing.
- Not everyone sees your post. Instagram, TikTok and Facebook decide for themselves who gets to see a post. People who don’t see it can’t react, but they still count.
On TikTok the gap is smaller, because most views come from people who don’t follow you: per view, engagement stays at around 6.5% even for large accounts.
How to improve your engagement rate
- Start strong. In the first seconds of a video, or by the first line of your caption, people decide whether to carry on.
- Ask an easy question. Let people choose between two options or finish a sentence. That works better than “leave a comment”.
- Reply to comments with a follow-up question. That way one comment turns into a conversation.
- Choose the format that works. Among business accounts on Instagram, carousels had the highest engagement rate in 2025: 0.55%, against 0.52% for Reels and 0.37% for single photos.
- Make something worth saving or sending on, such as a handy list or a step-by-step plan.
- Collaborate. According to Emplifi, collab posts on Instagram brought small brands (under 10,000 followers) 3.4 times as many interactions as regular posts at the end of 2024.
- Post regularly, at times when your followers are online. Your account statistics show when they are most active (on Instagram with a professional account). For TikTok, see the best time to post on TikTok.
For more ideas, read free TikTok likes and followers: what works and what doesn’t and how to get more YouTube views for free.
What bought and fake followers do to your engagement rate
Followers who do nothing still count in the calculation. With 4,000 followers and 156 interactions per post, you are at 3.9%. Add 5,000 followers while your likes stay the same, and that drops to 1.7%.
That also applies to our standard followers: real-looking, high-quality profiles that count like normal followers, but are not active people who like or comment. So they lower your engagement rate.
Bought likes work the other way round: they count in the formula, but they bring no genuine reactions or viewers, and nobody can promise you more reach. If you still want to give a new post a push, you can do so with Instagram likes or TikTok likes. Our Dutch Instagram followers are 100% real and active Dutch profiles (useful if your audience is in the Netherlands), although even then your content decides whether they react.
Buying for your own account is not against the law, but the platforms don’t allow it in their terms and can remove part of it. For businesses and influencers, misleading consumers with bought likes, followers or endorsements has been forbidden in the EU since 28 May 2022: read whether buying likes is legal first.
Frequently asked questions about engagement rate
What is a good engagement rate on Instagram?
That depends on your number of followers. With 1,000 to 5,000 followers, 3.5 to 4.8% likes per post is normal and above 6% is high; from 10,000 followers, anything above 1% is already good. Brands score lower, with a median of 0.30% in 2025.
What is a good engagement rate on TikTok?
On TikTok you usually calculate per view. Under 10,000 followers, 11 to 13% is typical and above 15% is excellent; for larger accounts, above 7% is good. Per follower it is lower: brands had a median of 2.01% in 2025.
How do you calculate engagement rate?
Add up the likes, comments and shares on a post, divide the total by your number of followers and multiply by 100. Use the average or the middle value of your last 10 to 12 posts. For TikTok and YouTube you usually divide by views instead of followers.
What is a good engagement rate on YouTube?
Per view, the middle half of channels got about 2 to 6.8% likes and comments on long videos in August 2026; for Shorts the median was around 2.2 to 2.7%. Because YouTube has counted every view from the first frame since 24 August 2026, newer figures may come out lower.
Do bought followers lower my engagement rate?
Yes, if they don’t engage. Our standard followers are real-looking, high-quality profiles and not active people, so without extra likes your engagement rate goes down. That is why it is better to grow in steps.


Need help with your order?
Mazie and Jane from our customer service team help you through the live chat (Monday to Friday 9:00 to 20:00, Saturday 9:00 to 16:00) or by email at support@likes-kopen.nl. We usually reply within an hour, in Dutch, English, German or French. Meet our team.